Are you looking for the best data visualization books to help your professional quest? Do you desire to own study materials that will help you understand the most challenging aspects of data visualization? If you answered yes to any of the questions, then you are in the right place. Regardless of your present situation, this guide would help you find the right data visualization book for your needs. Data visualization is a vast subject, and to understand the different aspects of it; you’ll need detailed explanations and practical examples.
This article contains a list of the best data visualization books to help walk you through your learning stage. Each of the recommended data visualization books in this list is detailed enough with the right information to help you. If you do not find the right book from this list, we will provide tips that will help you choose by yourself. Read in to learn more about the best data visualization books for you.
If you want to just get back to studying, get our top pick for data visualization books here.
Our Favorite for Best Data Visualization Books
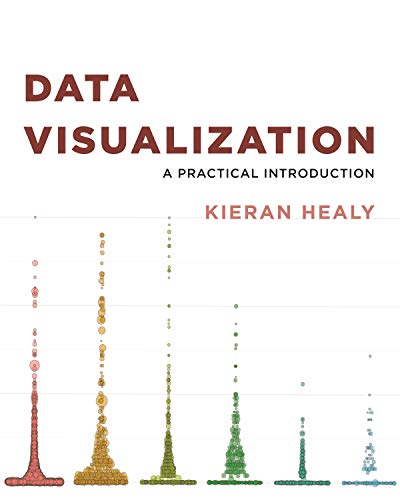
Data Visualization: A Practical Introduction by Kieran Healy
Simply put, Data Visualization: A Practical Introduction is an accessible primer that can guide you through creating effective graphics from data. It's a research book that suits both students and researchers, offering them a hands-on introduction to data visualization principles and practice. The book provides a simplified explanation of why certain graphs fail while others succeed. It also includes a description of how data researchers can make high-quality figures from data using robust and reproducible methods.Data Visualization: A Practical Introduction doesn’t just introduce readers to the principles of data visualization, but it also builds your knowledge of ggplot2, a versatile visualization library for the famous R programming language. This book makes use of several worked examples to explain how plots can be created, starting from summaries of single variables before progressing to more complex graphics.
What Makes It Unique:
- Data Visualization: A Practical Introduction does not only provide hands-on instruction using R and ggplot2. It also includes a detailed explanation of codes and functions to help walk you through understanding data visualization.
- The book is loaded with practical skills that students and practitioners can leverage to visualize quantitative data, getting the most out of their research findings.
- The author includes clear and understandable graphics that are essential to communicate ideas.
- Data Visualization: A Practical Introduction is a wonderfully formatted book, filled with careful insight to walk you through an important niche.
- This is one single book that represents the perfect entry point into an otherwise difficult niche.
- Well written, beautiful, and simplified in a way that's not usual for technical books.

The Visual Display of Quantitative Information by Edward R. Tufte
Despite having a cover that most people consider quite bland, The Visual Display of Quantitative Information by Edward R. Tufte ranks as one of the most logical and intuitive visual data books available today. An outstanding feature of this book is how the author blows you away by simplifying box and whisker diagrams into quantile plots, removing portions of the horizontal and vertical axis to make the graph more informative and easier to read.The classical book features tons of statistical tables, charts, and graphics to better explain the theory and practice in data design and visualization. Great for students and professionals looking for a reference book that covers everything from scratch.
What Makes It Unique:
- The Visual Display of Quantitative Information is mainly about creating efficient design and layout, and it performs excellently in conveying principles for clear and precise communication.
- It easily passes as the single most accessible book on data visualization, giving you a tour of the history of visualizations without leaving out contributions from some of the greatest minds in the field.
- The information contained in this book establishes the author as an authority on the subject of graphs, tables, charts, and data display.
- The Visual Display of Quantitative Information is a precise combination of great insight, excellent principles, and mind-blowing information presentation.
- It starts with an exciting introduction that catches your interest and doesn't drop tempo until the book's last page.
- Apart from being statistically excellent, it is also as visually intriguing as you'll need to maintain your interest in the subject.

The Book of Circles: Visualizing Spheres of Knowledge by Manuel Lima
The Book of Circles was written as a follow up to The Book of Trees and Visual Complexity, a book that gained massive popularity for how it takes users through the introductory part of data visualization. In The Book of Circles, the author takes readers on a lively tour through millennia of circular information design. The book uses over three hundred detailed and colorful illustrations of different types to cover an array of subjects.Lima uses this book to offer an authoritative history of the circle while maintaining a simplified taxonomy of infographics to aid easier understanding. The most significant feature of this book for most people is how it conveys information clearly and understandably, allowing users to properly understand the concept of excellent data visualization.
What Makes It Unique:
- Instead of focusing only on circular infographics, The Book of Circles goes deeper to explain the psychology behind the shape's appeal.
- This book is a ravishing tour that puts circular thinking in a whole new dimension.
- Although an advanced edition, this book still builds Upon the basics, walking inexperienced readers through what they'll need to become experts in this field.
- Unlike many other data visualization books, this one is wonderfully crafted With beautiful color photos offering clear illustrations.
- The Book of Circles features an array of innumerable examples all worked to give readers a clear understanding of how the topics can be applied.
- The contents of the book are visually engaging, illuminating, and clever.
Runner Ups for Best Data Visualization Books

The Functional Art by Alberto Cairo
The Functional Art is an excellent example of how data visualization books don't have to be filled with dry information. Instead, the book produces beautiful and engaging work without deviating from the data viz best practices. This book is just the right tool you'll need to make sense of all the vast amounts of free information you have access to. It does this by transforming numbers to graphical shapes so that readers can begin to the stories hidden in these numbers.Simply put, The Functional Art is a practical introduction that guides readers of different expertise levels to understand and use information graphics efficiently. The book emphasizes seeing data visualization as a tool for seeing beyond lists of numbers and variables present around us. In addition to this information, the book also offers a slight peek into the creative process of some of the most talented designers around the world.
What Makes It Unique:
- The Functional Art injects a mature, thoughtful, and scientifically grounded into an otherwise chaotic world of infographics.
- The author integrates the form and function of infographics into a design philosophy that will last through generations.
- This is the book for readers that care about learning how visualization is used to communicate with people.
- The Functional Art offers some sort of balance between aesthetics and functions in the world of data visualization.
- It is a combination of brilliant, didactic, and entertaining literature, with each chapter offering enough value to get you closer to becoming an expert.
- Excellent book for everyone, non-respective of your level of expertise in data visualization.
- It is a sensible and comprehensive book that can be used for self-study despite containing real-world infographics.
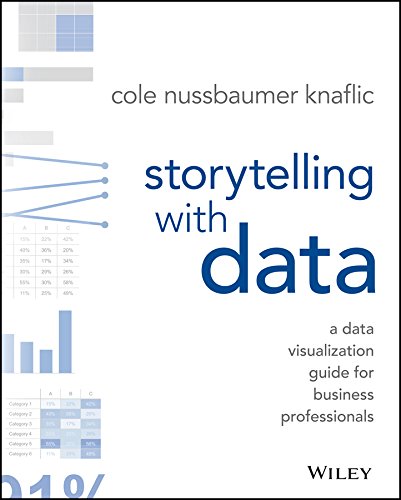
Storytelling With Data: A Data Visualization Guide for Business Professionals by Cole Nussbaumer Knaflic
Most data visualization teachers find this book amazing for its ability to bridge the gap between analytics and presentation. The book is unique in how well it blends the two topics. Storytelling With Data doesn't just show your data - it goes ahead to tell a story with it. Apart from introducing you to data visualization fundamentals, storytelling with data also shows you how to communicate with data. This illuminative text contains lessons that are well-grounded in theories and several real-world examples to get you ready to apply your knowledge.This book’s contents demonstrate steps that will take you beyond conventional tools to reach the root of your data. It also illustrates how you can use your data to create an informative, engaging, and compelling story. The author covers several topics that you can leverage to make your audience resonate with the data that you are visualizing.
What Makes It Unique:
- Storytelling With Data uses simple examples to explain to readers how they can use data to communicate to their audience.
- Throughout the book, the author attempts to provide a good foundation for readers to build upon with more advanced book coverings.
- Instead of focusing on just the data, this book teaches its readers to focus on telling the story behind each data presentation.
- The book is reasonably short to read, with tons of examples to make real-life applications easier.
- Storytelling With Data brings the writer's unique talents together in an easy-to-understand guide, with simplified examples to encourage smart decision-making.
Value Picks for Best Data Visualization Books

Infographics Designers by Steven Heller and Rick Landers
Infographics Designers' Sketchbooks is a book that leverages eye-grabbing presentations to inspire your creative efforts in data analytics and visualization. An impressive feature of this book is its ability to offer readers a rare glimpse into the thought process of some of the best graphic designers around the world. Learning these creative processes will help you spot the link between data and drawings. Overall, the book serves as a tool that walks to through the process of creating stunning infographics that you can use to present critical information in an easy-to-understand manner.This revelatory collection is the first to leverage several designers’ knowledge to reveal the art and craft behind infographic designs. It emphasizes idea-generating methods starting from topics like doodles and drawings to digital mock-ups.
What Makes It Unique:
- It contains useful information that can serve as a source of inspiration to publishers, graphics designers, and data professionals looking to give their data presentation the life it needs to attract attention.
- Being a testament to up to fifty designers' sketching process, this book shows how designers can sort through complex ideas using their pens.
- Infographics Designers' Sketchbooks provides an in-depth look into creative processes leading to the production of some of the world's leading data visualization.
- The availability of tons of real-world examples helps to make the learning process easy for starters and advanced learners alike.
- The author of this book adopts a genuinely innovative writing skill to communicate a rather complicated subject in an easy-to-understand manner.

Fundamentals of Data Visualization: A Primer on Making Informative and Compelling Figures by Claus Wilke
Fundamentals of Data Visualization is one of the few data visualization books that's targeted at students, educators, and data visualization professionals. The book offers you a clear, straightforward, and in-depth introduction into the world of data visualization. Several data scientists from around the world are adopting it as a manual for learning how to succinctly and accurately convey the essence of data. The author doesn't shy away from showing bad examples; instead, he expertly blends both good and bad examples to show that you can get through the mistakes in data visualization and still become an expert in the field.The book focuses on teaching that effective visualization is the best way to communicate information. Chapter by chapter, Fundamentals of Data Visualization takes you through several common problems encountered in data visualization, providing guidelines that you can leverage to turn large datasets into clear and compelling figures. Overall, it is possibly the best data visualization book for practicing students, especially considering that the author lays out the principles behind the choices he’s making.
What Makes It Unique:
- The author uses this book to teach how figures in documents and reports can be employed effectively to tell compelling stories.
- The book takes a chapter by chapter approach to build the readers about the concepts that make a good data visualization.
- An excellent resource for students, instructors, professionals, and anyone who has a passing interest in data visualization.
- Fundamentals of Data Visualization adopts a simple organizational style. It is divided into logical chapters, with a structure that's easy to reference back.
- It contains several excellent illustrations that help in further explaining the concept of excellent data visualization.
- A well-written book that provides the rationale behind different types of data visualization.
How to Choose the Best Data Visualization Books for You
Despite the availability of several data visualization books in the market, picking the one that's best for you can still be a mundane task, especially if you do not know where to look for it. The truth is that your choice of books can either make or break your journey towards learning data visualization. Thankfully, there are tons of well written visual data books in the market. However, you'll need expert guidance to get the best of them.Our best data visualization books guide contains a list of top books according to user reviews. However, if none of the options cuts it for you, you can pick from the numerous other options available in the market. To help guide your choice, we’ve highlighted some questions. The answers to these questions are the best books for your data visualization needs. Take a look at them.
Do You Want to Learn About Data Visualization Theory?
Although a very practical subject, data visualization still contains its own but of theory. Understanding the theories in it helps you to apply the practical aspects better. Many introductory books start from data visualization theory before moving on to its application. For starters, you'll need to get such books that will ground you in the introductory theories. Most of the books highlighted above combine data visualization theory and its application, so you can make your choice, guaranteed that your journey into the world of data visualization would be worth it.Are You Interested in Gaining Deeper Understanding of Data Visualization?
This is one question you need to ask yourself and be sincere with your answer before going to the marker for a visual data book. Many learners are only interested in gaining a passing knowledge of the subject and so would not necessarily need many details. However, if you want to practice data visualization as a professional, you'll want to go for a data visualization book covering all the in-depth information.Some books take you on tour through the most in-depth data visualization application by offering tons of real-life examples. These kinds of books would keep you updated with happenings in the world of data visualization, but it will also help familiarize you with real-world application visualizing data.
Are You a Data Viz Expert?
The term, data visualization, covers several areas. As a data visualization expert, you'll need books that cover as many data visualization areas as possible. You would need a book that covers the best practices in the chart, features excel-type graphics, and offers top-notch interactive visualizations. If, as an expert, you are looking for a material that will guide you to start producing data visualization, then it would be best to pick up a book on processing.Overall, you want a book that touches different areas but goes in-depth on the topics you want to get better in. If you are confused about the right books to purchase here, then you can ask your book vendor for suggestions or read the numerous reviews available on online data visualization book stores.
What Data Visualization Book Meets Your Budget
The budget is a vital aspect to consider before any purchase. Data visualization books vary in price and value. You would likely find different options that will suit your budget. However, you'll need to get the best among the options available for your budget. The options described in our 'value picks' session are great, but you can look up other options online to find what fits your needs perfectly. However, you'll need to be careful not to sacrifice quality for price.Wrapping Things Up: The Best Data Visualization Books
Putting everything together, in this guide we reviewed the following:It’s a wrap, a detailed article featuring the best data visualization books in the market. Although a complex subject, data visualization is enjoyable when you have the right tools and knowledge for it. Whether you are a beginner or a data visualization professional, you’ll need great books to help you understand the best data visualization techniques. The books featured in this guide are all informative enough with the right examples to help you get through the challenging aspects of data visualization. We hope that you can find some that will help you become an expert on the subject.
However, if none of the books highlighted above seems to be doing it for you, perhaps it’s time for you to embark on a search yourself. The second part of this article contains questions and tips that will help you get the correct data visualization books for your needs. A sincere answer to the questions highlighted in this section will help you realize what exactly you need.
Not ready to sort through excess details, then you can jump straight to our favorite pick, Data Visualization: A Practical Introduction by Kieran Healy, an accessible primer that can guide you through creating effective graphics from data. Our runner up, The Functional Art by Alberto Cairo, explores the art in data visualization. It offers a clear explanation on how to convert data from a string of dry statistics into a captivating, and well-presented information.
Looking for more financial and professional books? Check them out below:
> The Best Database Design Books